
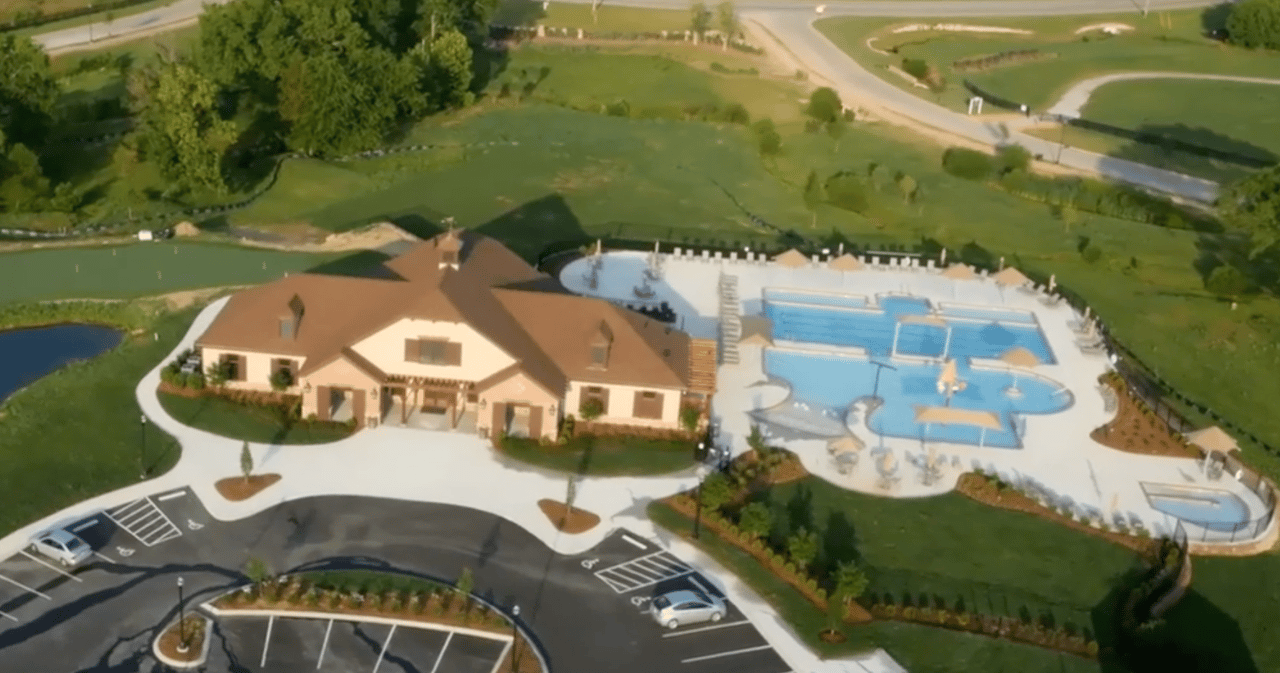
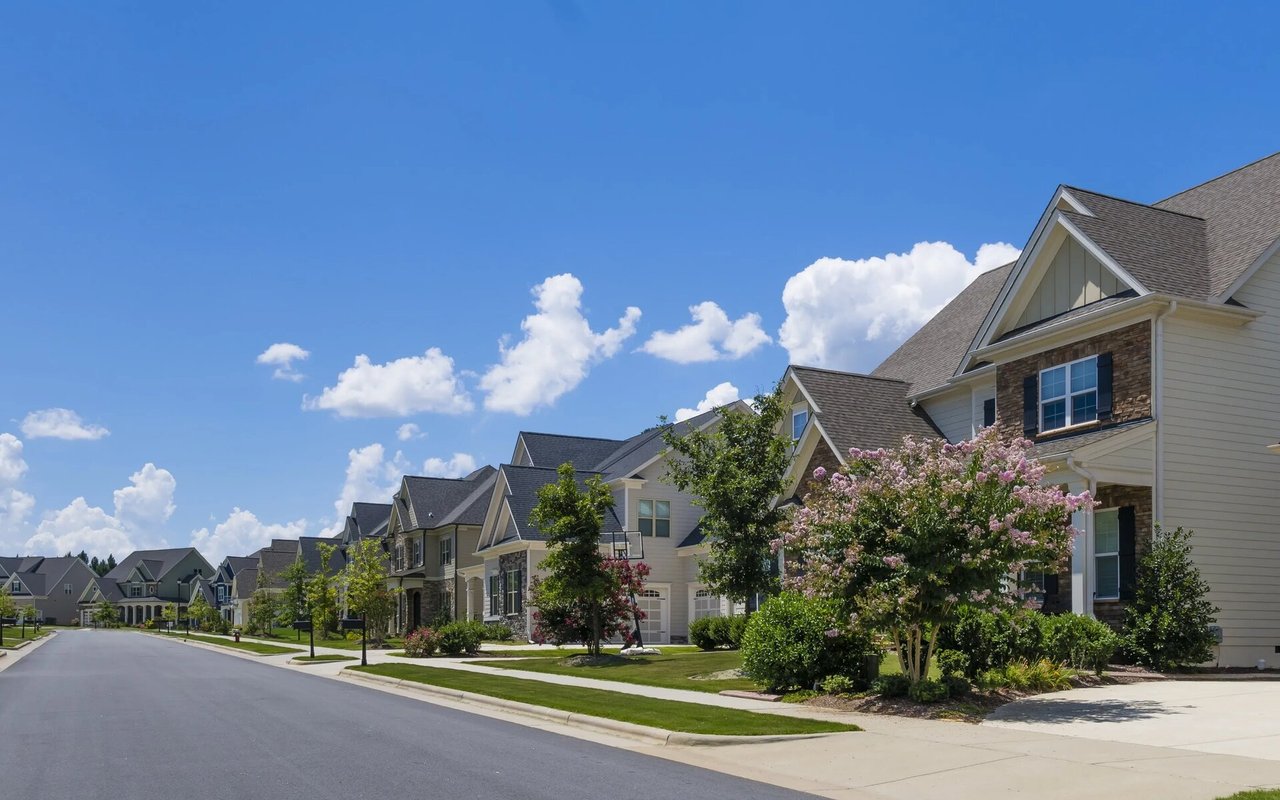
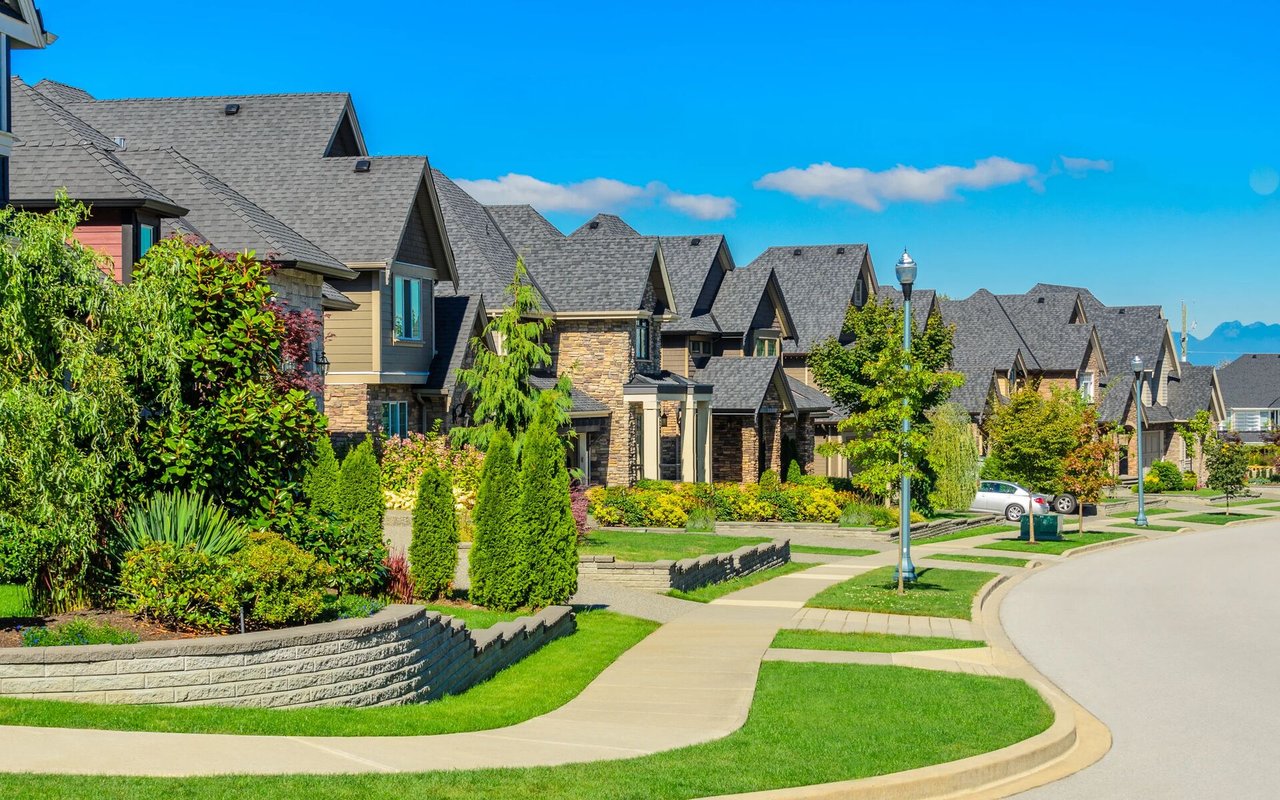
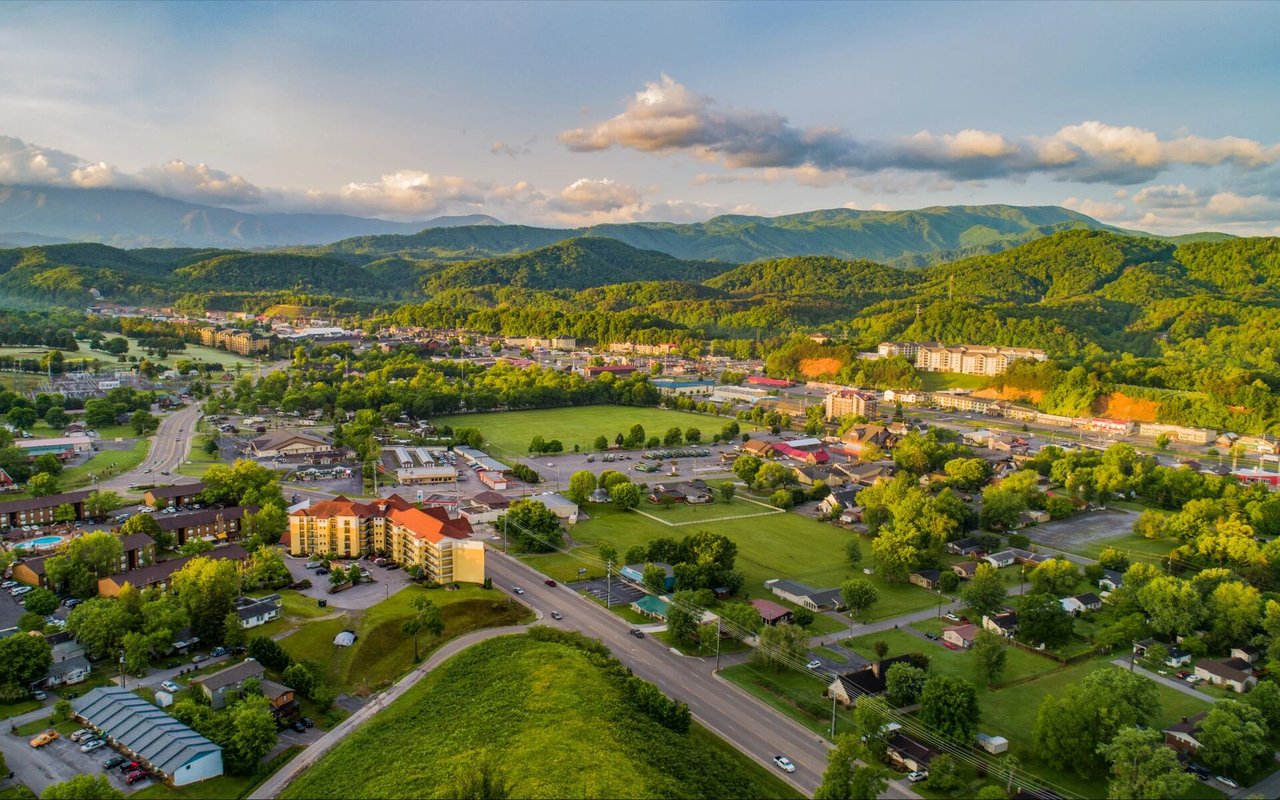
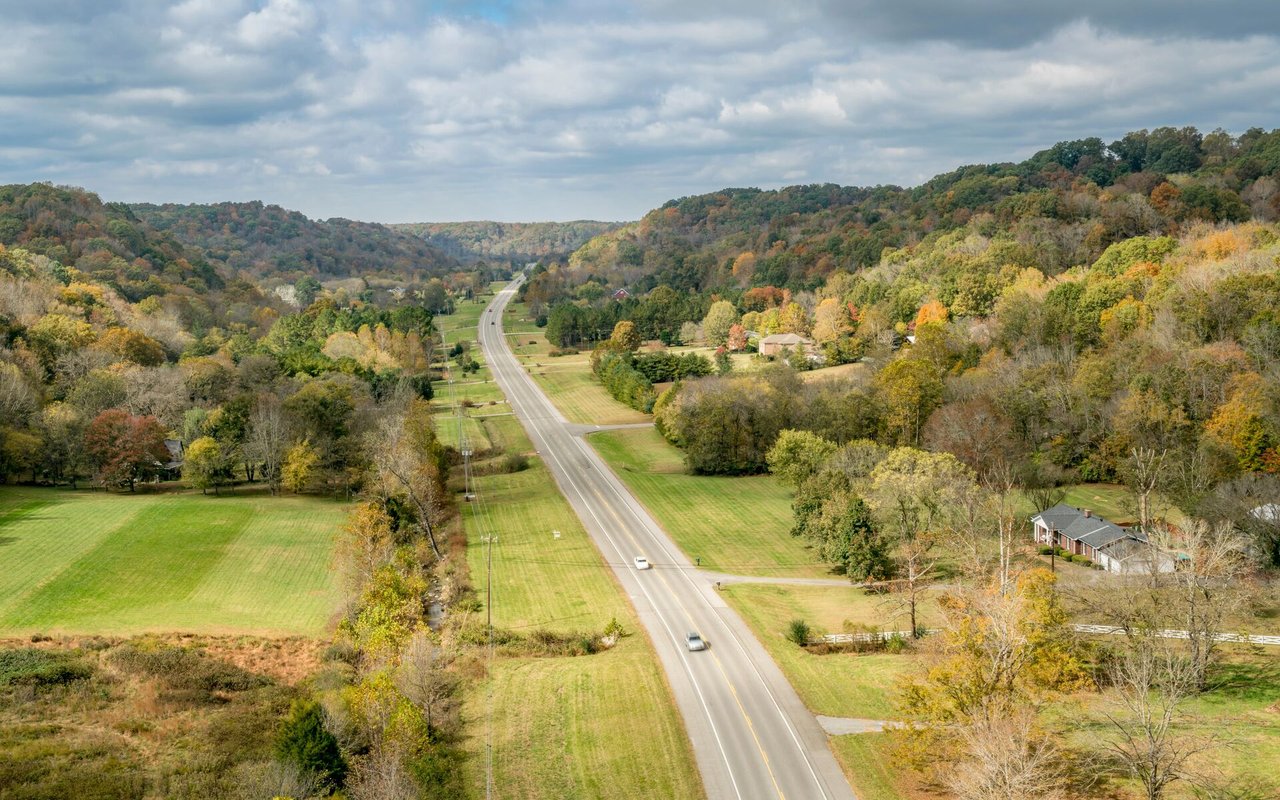
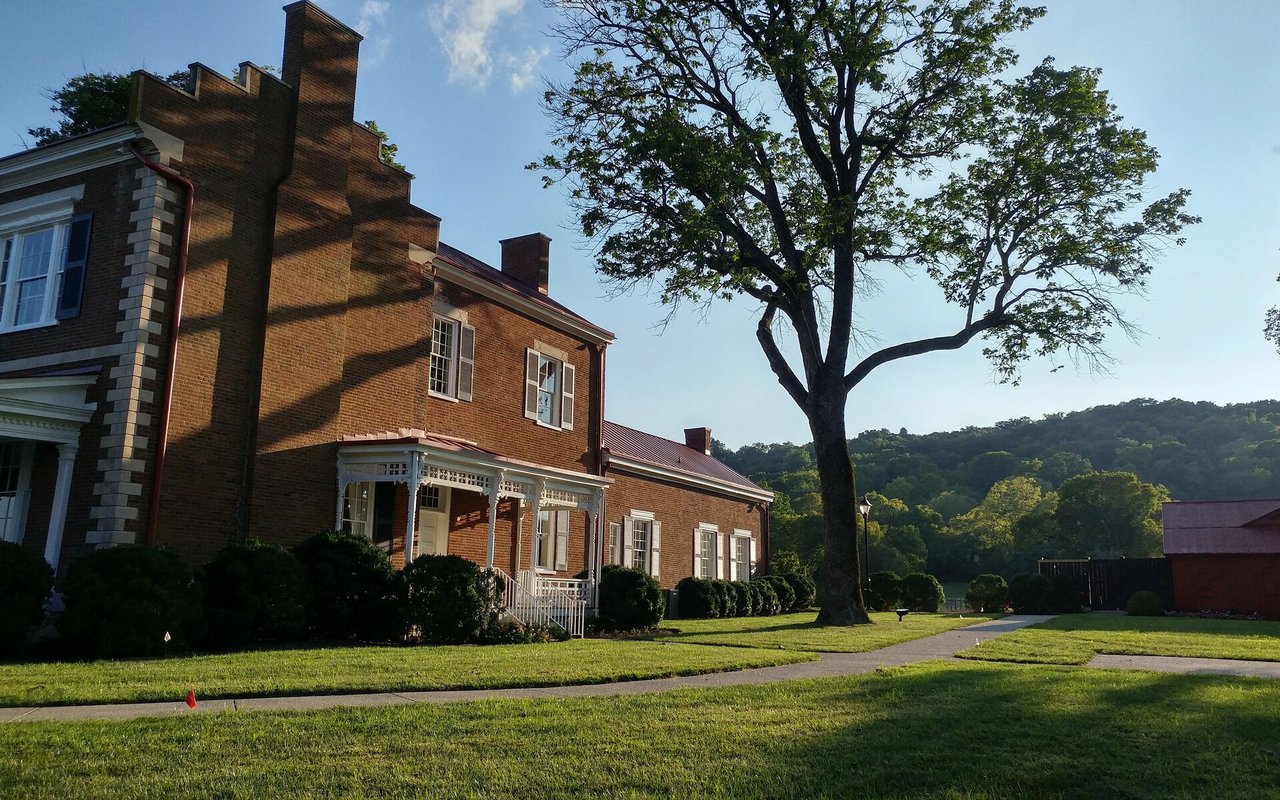
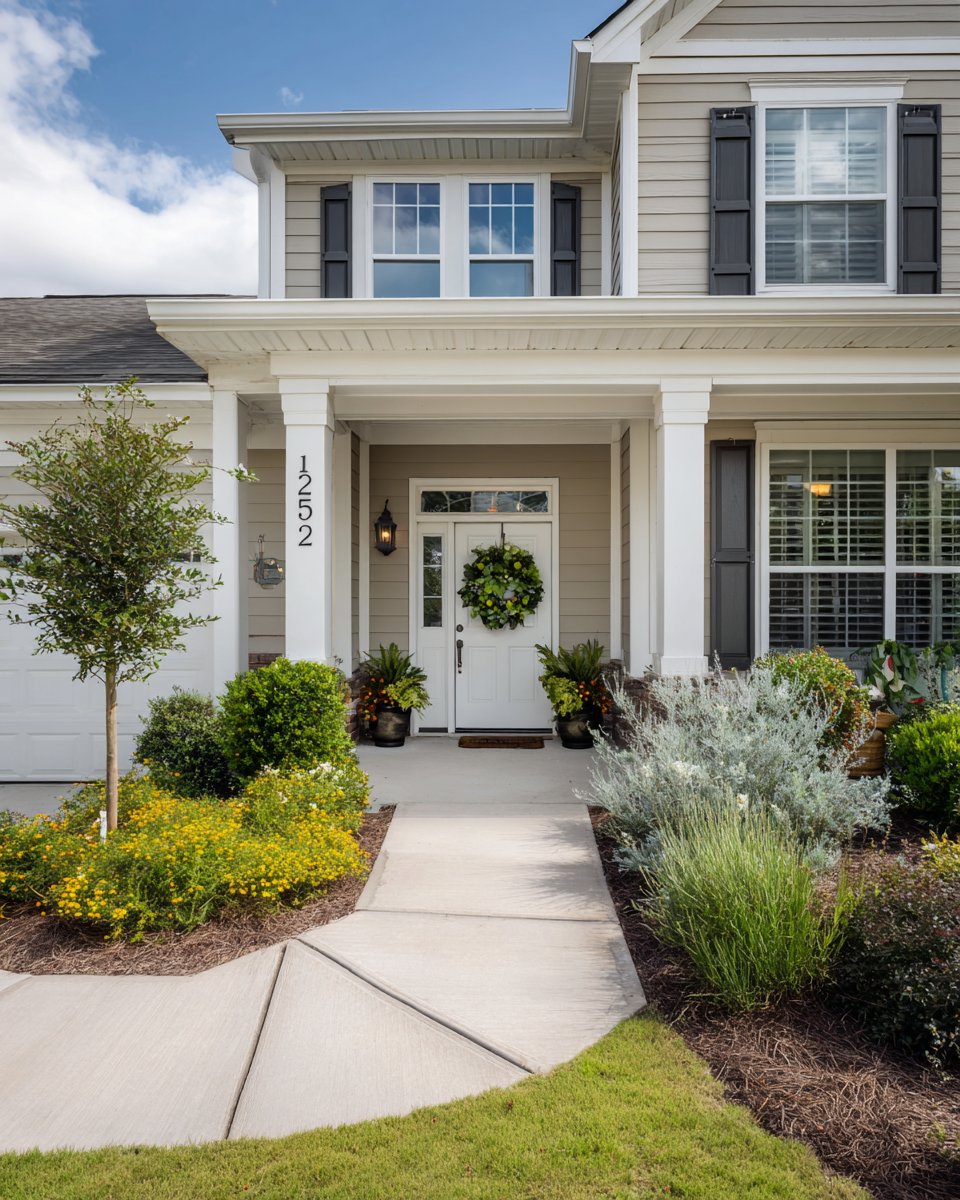
Falls Grove in College Grove is a family-friendly community known for its scenic surroundings, spacious parklands, and inviting atmosphere, offering comfortable single-family homes on generous lots. This welcoming subdivision emphasizes community-focused amenities and natural beauty, making it ideal for families of all sizes seeking a balanced lifestyle. Located in Williamson County with easy access to major roads, it's just minutes from Franklin and 30-40 minutes from Nashville, providing a peaceful retreat with convenient proximity to urban conveniences.
Amenities:
Schools:
Public schools zoned for the area (Williamson County Schools; confirm exact zoning with address via WCS zone finder, as boundaries vary):
Private schools in the broader College Grove/Franklin area (short drive away):
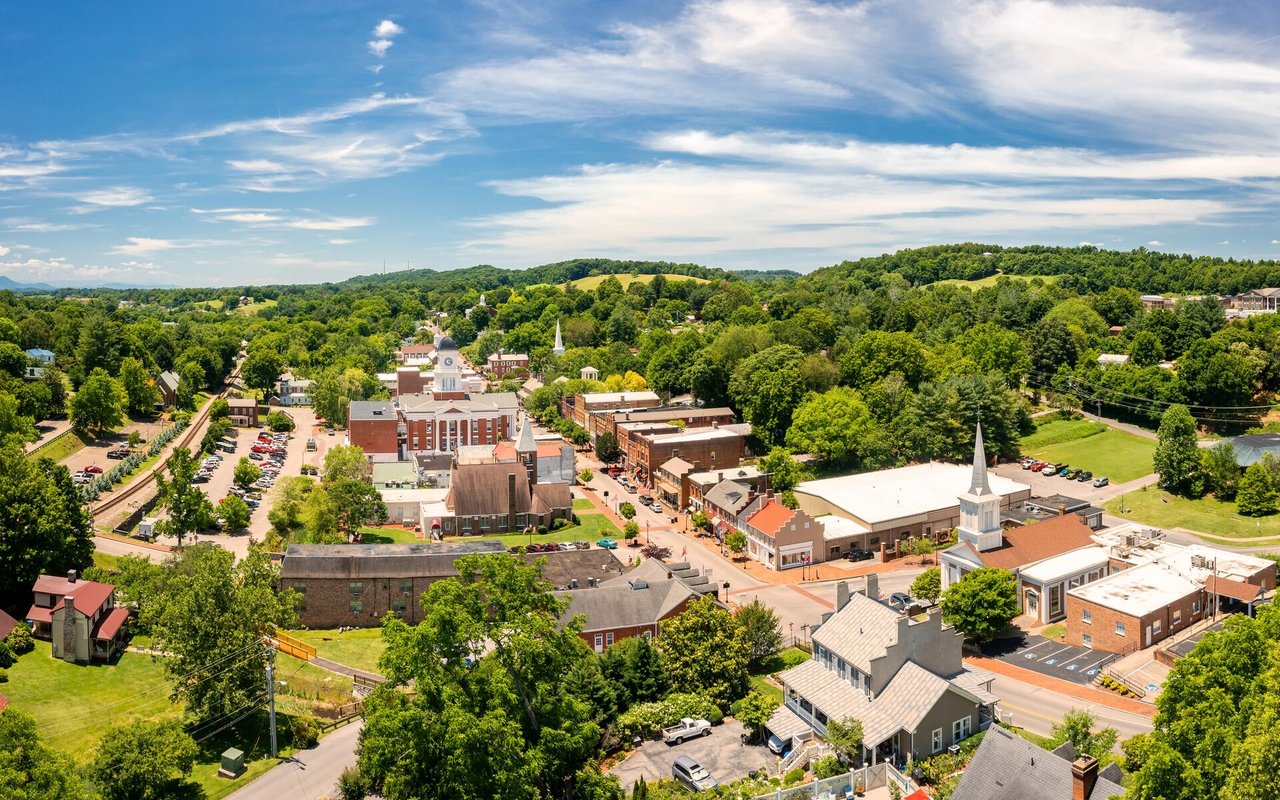
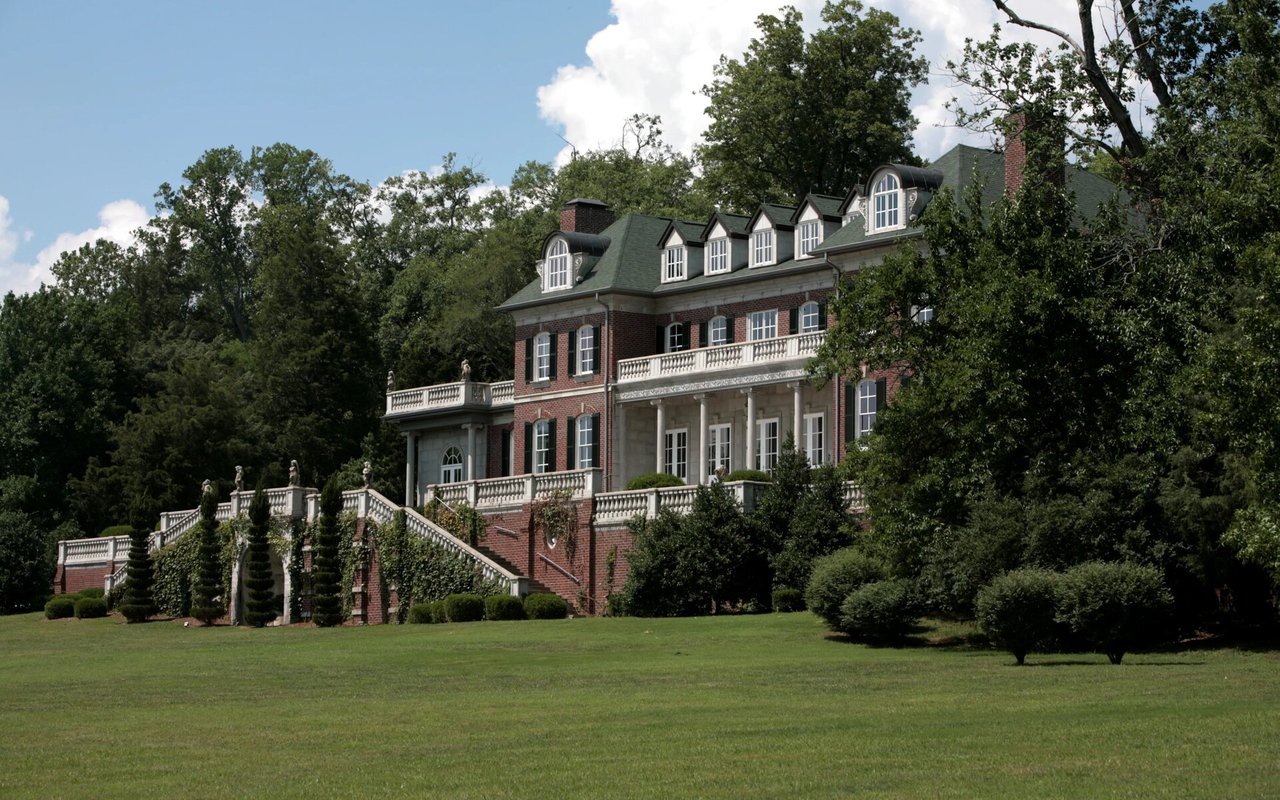
Nearby Entertainment and Activities:
6,632 people live in Falls Grove, where the median age is 45.5 and the average individual income is $91,200. Data provided by the U.S. Census Bureau.
Total Population
Median Age
Population Density
Average individual Income
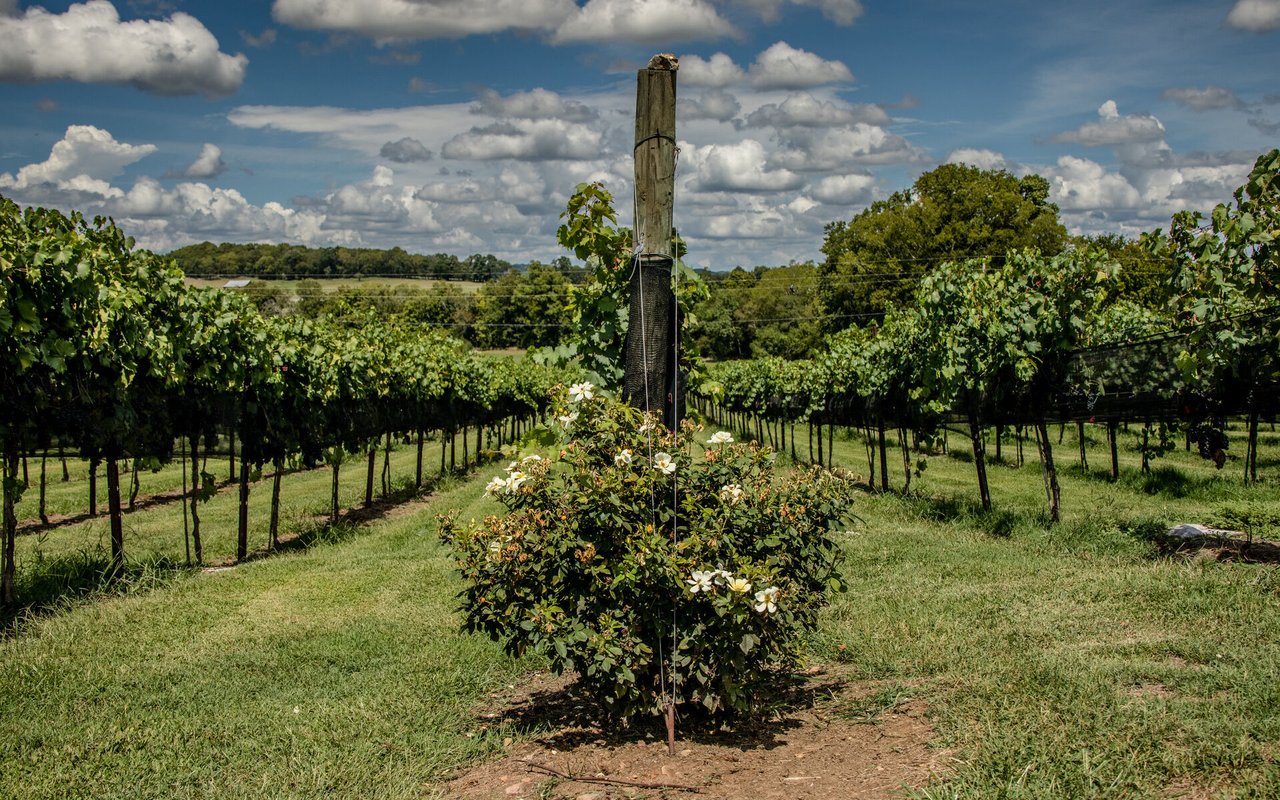
There's plenty to do around Falls Grove, including shopping, dining, nightlife, parks, and more. Data provided by Walk Score and Yelp.
Explore popular things to do in the area, including Hatcher Family Dairy, Grindstone Cowboy, and Delvin Farms.
| Name | Category | Distance | Reviews |
Ratings by
Yelp
|
|---|---|---|---|---|
| Dining · $ | 2.67 miles | 22 reviews | 4.9/5 stars | |
| Dining · $$ | 4.52 miles | 78 reviews | 4.6/5 stars | |
| Dining · $$ | 4.43 miles | 11 reviews | 4.5/5 stars | |
|
|
||||
|
|
||||
|
|
||||
|
|
||||
|
|
||||
|
|
Falls Grove has 2,503 households, with an average household size of 2.65. Data provided by the U.S. Census Bureau. Here’s what the people living in Falls Grove do for work — and how long it takes them to get there. Data provided by the U.S. Census Bureau. 6,632 people call Falls Grove home. The population density is 93 and the largest age group is Data provided by the U.S. Census Bureau.
Total Population
Population Density Population Density This is the number of people per square mile in a neighborhood.
Median Age
Men vs Women
Population by Age Group
0-9 Years
10-17 Years
18-24 Years
25-64 Years
65-74 Years
75+ Years
Education Level
Total Households
Average Household Size
Average individual Income
Households with Children
With Children:
Without Children:
Blue vs White Collar Workers
Blue Collar:
White Collar:


THE ROUNSAVILLE GROUP
(615) 607-1012
[email protected]
(615) 650-3080
[email protected]
ADDRESS
75 Industrial Drive
Mt Juliet, TN 37122
THE ROUNSAVILLE GROUP
(615) 607-1012
[email protected]
(615) 650-3080
[email protected]
ADDRESS
75 Industrial Drive
Mt Juliet, TN 37122